Grafana: pfSense Per IP Usage Statistics Panel with NtopNG
Ever wanted to have per host usage statics with pfSense? I know I have for awhile. There are packages you can get from the package manager that will accomplish this. Both darkstat and bandwidthd will do this for you. They will host a webpage or web server on your pfSense router. They are pretty self explanatory on how to configure and access, and they work decently for a basic use case. However they have either non existent exporting mechanisms or not well documented ones. For us this is a no-go as Grafana needs exportable data. Luckily there is another option and that has multiple methods of export, NtopNG. This not only has a plugin for Grafana, but it also has a option to export to InfluxDB. For this guide, I’ll be using Influx as I am more comfortable with it, and I could not get the ntopng plugin for Grafana to work.
If you have not already setup Grafana and InfluxDB, we have a guide on how to set one up here: https://angrysysadmins.tech/index.php/2020/04/bailey/grafana-how-to-install-grafana-influxdb-on-centos-8/
InfluxDB
To get a database and user created run the following on your influx instance replacing the $variables with what you will be using.
create database $NewDatabase
CREATE USER $Username WITH PASSWORD '$Password'
grant all privileges on $NewDatabase to $Username
Ntop
NOTE: The webgui may crash during this step. This will not effect the routing of the network. You either need physical console access or ssh access to fix it. BEFORE continuing I’d suggest logging in via ssh. The fix is to restart PHP-FPM (option 16 on the console\ssh welcome screen). If the issue keeps happening just keep restarting php-fpm. This seems to only happen when accessing the ntopng settings, so in production it should not cause issues with anything else. If the ntopng webgui won’t come up restart the webconfigurator or reboot the machine
Logon to the pfsense webgui and go to System -> Package Manager. Click on Available Packages. In the search term field type ‘ntopng’ Then install the package. Once done with that, go back to the home page of pfsense
Next on the top menu go to Diagnostics -> ntopng Settings. Here you need to set a admin password and a interface to bind the ntopng webgui to. Choose LAN. Make sure to check enable ntopng. Hit save at the bottom.
Now we can access the ntopng webpage. go to Diagnostics -> ntopng. Log in with admin as the username and your password you just set.
Navigate to the gear at the top right and choose user preferences. Next click the timeseries button. From there change the timeseries driver from RRD to InfluxDB. Populate it with your database IP, DB, username, and password.
Grafana
Add the influxDB data source, then create a new panel. Here is an example panel I made. It will list all the active hosts with the inbound and outbound bandwidth totals.
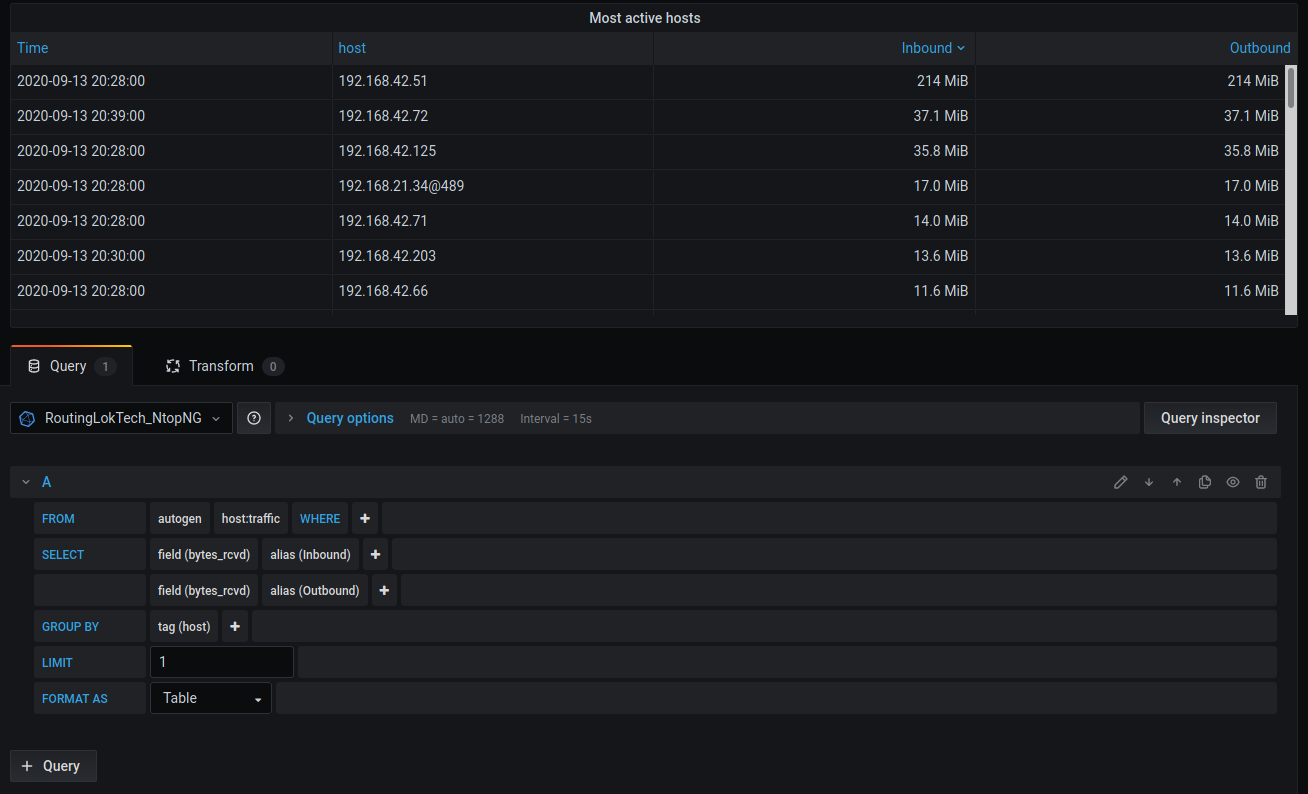
Click here for the JSON
{
  "annotations": {
    "list": [
      {
        "builtIn": 1,
        "datasource": "-- Grafana --",
        "enable": true,
        "hide": true,
        "iconColor": "rgba(0, 211, 255, 1)",
        "name": "Annotations & Alerts",
        "type": "dashboard"
      }
    ]
  },
  "editable": true,
  "gnetId": null,
  "graphTooltip": 0,
  "id": 18,
  "links": [],
  "panels": [
    {
      "cacheTimeout": null,
      "datasource": "RoutingLokTech_NtopNG",
      "fieldConfig": {
        "defaults": {
          "custom": {
            "align": null
          },
          "mappings": [],
          "thresholds": {
            "mode": "absolute",
            "steps": [
              {
                "color": "green",
                "value": null
              },
              {
                "color": "red",
                "value": 80
              }
            ]
          },
          "unit": "bytes"
        },
        "overrides": [
          {
            "matcher": {
              "id": "byType",
              "options": "string"
            },
            "properties": []
          }
        ]
      },
      "gridPos": {
        "h": 9,
        "w": 12,
        "x": 0,
        "y": 0
      },
      "id": 2,
      "interval": null,
      "links": [],
      "options": {
        "showHeader": true,
        "sortBy": [
          {
            "desc": true,
            "displayName": "Inbound"
          }
        ]
      },
      "pluginVersion": "7.1.5",
      "targets": [
        {
          "groupBy": [
            {
              "params": [
                "host"
              ],
              "type": "tag"
            }
          ],
          "limit": "1",
          "measurement": "host:traffic",
          "orderByTime": "ASC",
          "policy": "autogen",
          "query": "SELECT \"bytes_rcvd\" AS \"Inbound\", \"bytes_rcvd\" AS \"Outbound\" FROM \"autogen\".\"host:traffic\" WHERE $timeFilter GROUP BY host LIMIT 1",
          "rawQuery": false,
          "refId": "A",
          "resultFormat": "table",
          "select": [
            [
              {
                "params": [
                  "bytes_rcvd"
                ],
                "type": "field"
              },
              {
                "params": [
                  "Inbound"
                ],
                "type": "alias"
              }
            ],
            [
              {
                "params": [
                  "bytes_rcvd"
                ],
                "type": "field"
              },
              {
                "params": [
                  "Outbound"
                ],
                "type": "alias"
              }
            ]
          ],
          "slimit": "",
          "tags": []
        }
      ],
      "timeFrom": null,
      "timeShift": null,
      "title": "Most active hosts",
      "type": "table"
    }
  ],
  "schemaVersion": 26,
  "style": "dark",
  "tags": [],
  "templating": {
    "list": []
  },
  "time": {
    "from": "now-6h",
    "to": "now"
  },
  "timepicker": {},
  "timezone": "",
  "title": "TestingDash",
  "uid": "KMeK8SOGk",
  "version": 1
}
If anyone has any cool panels to add to this I’d be happy to post the JSON here and credit you for it! Just post it as a reply and I’ll add it.
Hey man. Can you post the JSON for this panel? The link is not working. Thanks!
Here you go
https://pastebin.com/ED8c1jq2
Hey, the link for the JSON is broken. Can you repost?
Here you go
https://pastebin.com/ED8c1jq2