Grafana: How to Install Grafana & InfluxDB on CentOS 8
Grafana is a platform used to visualize and analyze data from your network. It also has the ability to send alerts when certain conditions are met, and can import data from many of the popular ways to store it. I’ve recently been dedicating quite a bit of time to getting better at using it and trying to get the most out of it, because data it beautiful, and Grafana makes it about as easy as can be.
InfluxDB is a time series database, which essentially means that all entries are time stamped to make it easy to see how data changed over time. This makes Influx ideal for tracking various metrics from systems on a network. The collector that I will be using for my examples is called Telegraf, which is a product by the same company that makes InfluxDB
So over my next few articles, I plan to cover how to setup and make use of Grafana. I’ll be doing all of this on CentOS 8, but after the install process everything should be the same no matter which distro you prefer.
Installing Grafana
This article was written for Grafana 6.7.3, I’ll check if this process is the same when Grafana 7 is released and remove this text if it is.
Grafana maintains their own repository that we will have to add before we can install it. All the commands from here on in are going to assume that you are either acting as root, or are running them with sudo. To add the repo to dnf (CentOS’s package manager as of CentOS 8), we’ll need to make the file for it. Using whatever text editor you prefer, make the follow file:
[root@osmium ~]$ cat /etc/yum.repos.d/grafana.repo
[grafana]
name=grafana
baseurl=https://packages.grafana.com/oss/rpm
repo_gpgcheck=1
enabled=1
gpgcheck=1
gpgkey=https://packages.grafana.com/gpg.key
sslverify=1
sslcacert=/etc/pki/tls/certs/ca-bundle.crt
Now that the repo is added, we can install the package with:
[root@osmium ~]# dnf install grafanaGrafana Configuration
I won’t be covering how to setup HTTPS or LDAP in this article, so not much needs to be changed in the Grafana config for now. However, fields that may interest you are:
/etc/grafana/grafana.ini

[server]
# If your server is on multiple networks and you only want to allow connections from one,
# change this field to be the IP the server has on that network
# Or, if you are going to use a reverse proxy, change this to 127.0.0.1
http_addr

# Port 3000 is probably not used, but just in case keep this field in mind.
# I recommend setting up a reverse proxy if you want to make Grafana listen on port 80 or 443
http_port

[security]
# If you want to change the default admin user name, do so here and now
admin_user

# This password can be changed later.
# Do not set the password you plan to use long term in this field
admin_password

# AES-256 CFB key used to sign passwords and secret parts of the configuration.
# It can be a hassle to change later, so set it to something now or accept the default
# If you have pwgen installed, you make a random string with something like `pwgen -s -1 40`
secret_key
Once you have set the initial options as you like, we can start the Grafana service and move on to the web page setup.
[root@osmium ~]# systemctl enable --now grafana-server
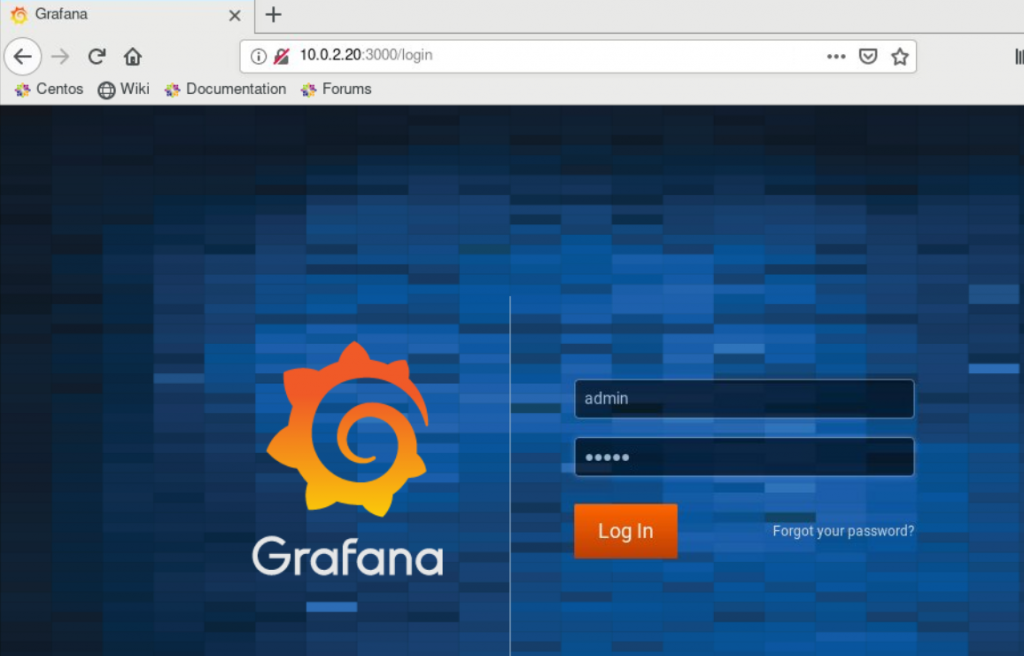
Once the service has started, access the web page that is being hosted from a web browser. You should be greeted with a page like below:
If you cannot load the page, trying opening port 3000 in the firewall by doing:
[root@osmium ~]# firewall-cmd --add-port=3000/tcp
If that fixes the problem, run the same command with --permanent to make the change persistent.
On your first sign in you should be asked to change the admin user’s password to something more secure. I strongly recommend doing so.
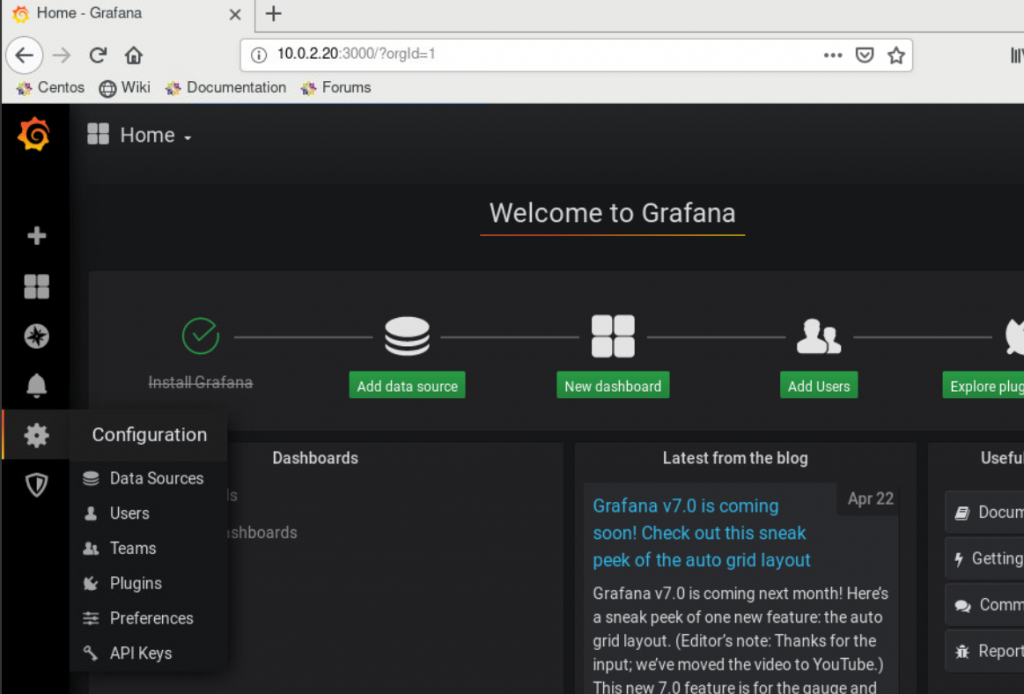
Take some time to get used to the layout. Because we don’t have any data sources setup yet, there’s not much that can be done. But if you go through the preferences tabs, you can do things such as set the Organization Name, add new users, and setup Teams (which can be used to have different groups of users with access to different dashboards).
Installing InfluxDB
This article was written for Influx 1.8.0
In order for Grafana to be useful, it needs data sources. And one of the most commonly used is InfluxDB. As with Grafana, the first step is to setup the repository.
[root@osmium ~]# cat /etc/yum.repos.d/influxdb.repo
[influxdb]
name = InfluxDB Repository
baseurl = https://repos.influxdata.com/rhel/8/x86_64/stable/
enabled = 1
gpgcheck = 1
gpgkey = https://repos.influxdata.com/influxdb.key
And then install the package:
[root@osmium ~]# dnf install influxdb
InfluxDB Configuration
Influx requires a bit more setup than Grafana did, especially because I want password authentication on the command line.
First, edit the config file /etc/influxdb/influxdb.conf and in the [http] section set the following field:
[http]
  # false by default, but security is good so we're enabling it
  auth-enabled = true
And now start the service so that we can finish configuring it:
[root@osmium ~]# systemctl enable --now influxdb
Now we can connect to influx, create the first user and database, and move on.
[root@osmium ~]# influx
Connected to http://localhost:8086 version 1.8.0
InfluxDB shell version: 1.8.0
> CREATE USER admin WITH PASSWORD 'password123' WITH ALL PRIVILEGES
> auth
username: admin
password:
> CREATE DATABASE pfsense
> SHOW DATABASES
name: databases
name
----
_internal
pfsense
CREATE USER will make the first admin user, which can be used in the future to manage users or databases. auth signs us in as that user. And then CREATE DATABASE adds a database that we will use in the future to receive data from telegraf.
The first user created MUST be done with WITH ALL PRIVILEGES, as it will act as the super admin. Other users can be created with more specific permissions and access to only certain databases. That can be done as follows:
> CREATE USER pftelegraf WITH PASSWORD 'pfsense telegraf password'
> GRANT ALL PRIVILEGES ON pfsense TO pftelegraf
Where ALL PRIVILEGES can be READ, WRITE, or ALL.
Because data will be coming from other boxes on the network, you will most likely need to open a port in the firewall. That can be done by running:
[root@osmium ~]# firewall-cmd --permanent --add-port=8086/tcp
Add Data Source to Grafana
Now that Influx is setup, we can add the database we just made to Grafana as a data source. Once that is done, any dashboards that we can make can use it to get data for graphs.
Go back to the Grafana web page. From your home dashboard, click on the Gear on the left, and then Data Sources.
This will open a list of all your data sources, which should currently be empty. So click the giant green Add Data Source button, and then from the list that shows up select InfluxDB.
Within the configuration page that comes up, we’re interested in five sections: Name, URL, Database, User, and Password. For me those will be set as follows:
Name: pfSense
URL: http://localhost:8086
Database: pfsense
User: pftelegraf
Password: pfsense telegraf password
Fill in those fields, and then click “Save & Test” (the green button) at the bottom of the page. It should return “Data source is working”, which means we’re good to actually make dashboards now!
The next article will cover making a dashboard for a pfSense firewall using Telegraf and the InfluxDB database that we just added as a data source. You can read that here.
Hi
I am trying to install Grafan on centos but when I run this cat /etc/yum.repos.d/grafana.repo i am getting cat: /etc/yum.repos.d/grafana.repo: No such file or directory
ANy help, thanks
The
catthat I used in the article was just to show what the contents of that file should be. In a normal install of CentOS that file won’t exist, so you need to use a file editor such asnanoorvimto create it and make sure that the contents match the output of mycat.That was not a very angrysysadmin response.
cat <<EOF | sudo tee /etc/yum.repos.d/influxdb.repo
[influxdb]
name = InfluxDB Repository
baseurl = https://repos.influxdata.com/rhel/8/x86_64/stable/
enabled = 1
gpgcheck = 1
gpgkey = https://repos.influxdata.com/influxdb.key
EOF