Grafana: Creating a Dashboard for pfSense
In the previous article I went over how to setup Grafana and InfluxDB. In this one, I’ll be going over how to make use of them to have a dashboard that show metrics from a pfSense firewall.
Going forward I will assume that you have Grafana and InfluxDB configured as described in the previous article, that the pfsense database exists in Influx, and that you have a working pfSense installation.
pfSense
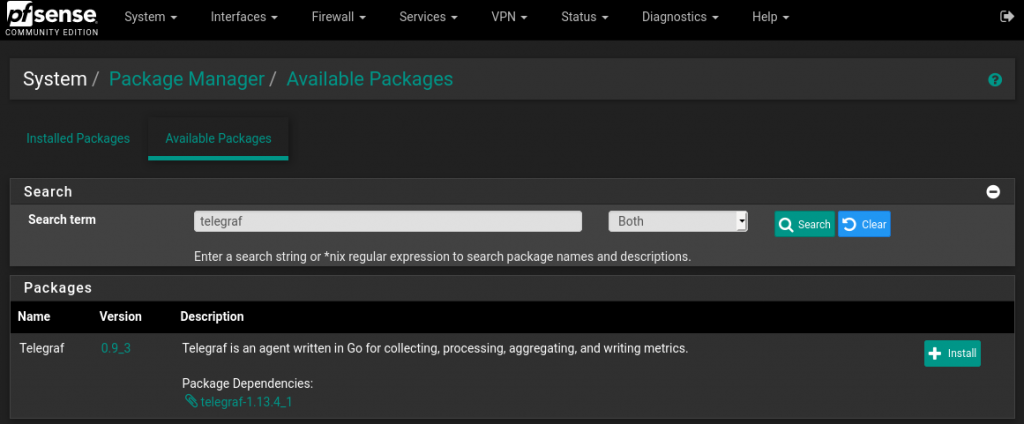
I am going to start by setting up Telegraf on pfSense to send data to the Influx database. Thankfully, Netgate and Influx provide a package that allows us to install and configure Telegraf from the web interface. So on pfSense, go to System -> Package Manager -> Available Packages and search for Telegraf.
The install should be pretty quick. Once it finishes, there will be a new option in the Service dropdown. So to configure Telegraf, select it from that list.
There are several fields of interest here, so here is what I set each important section to:
Enable: check
Telegraf Output: InfluxDB
InfluxDB Server: http://10.0.2.20:8086
InfluxDB Database: pfsense
InfluxDB Username: pftelegraf
InfluxDB Password: pfsense telegraf password
HAProxy: check
Once you have Telegraf configured to match your Influx setup, hit Save. That should automatically have Telegraf start sending data (you can double check by going to the Services tab under the Status dropdown).
Now that Telegraf is sending data for us to use, we can go on to setting up the dashboard.
The Dashboard
One of the best parts of Grafana is the large community of people publishing dashboards for everyone to use. You can search through them here. For this article, I will be using this one by mhaluska.
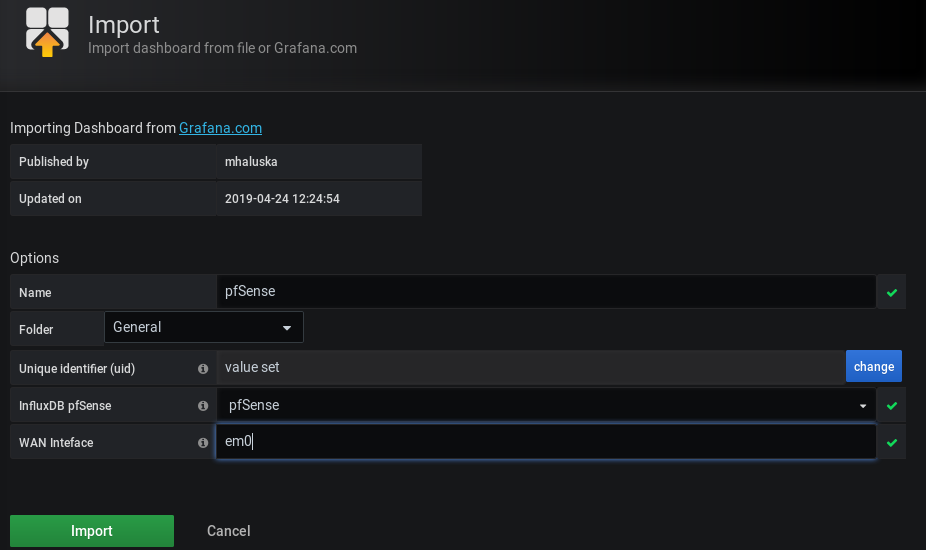
To add a dashboard from the community, go to your Grafana web page and hover over the large + on the side bar, then click Import. On the page that opens, we can either paste in the JSON of a dashboard, or enter a dashboard ID. Enter 10095 in the ID section.
There’s a bit of dashboard specific configuration that needs to be done. In this case, the WAN interface for pfSense. Mine is an oVirt VM, so for me the interface is em0.
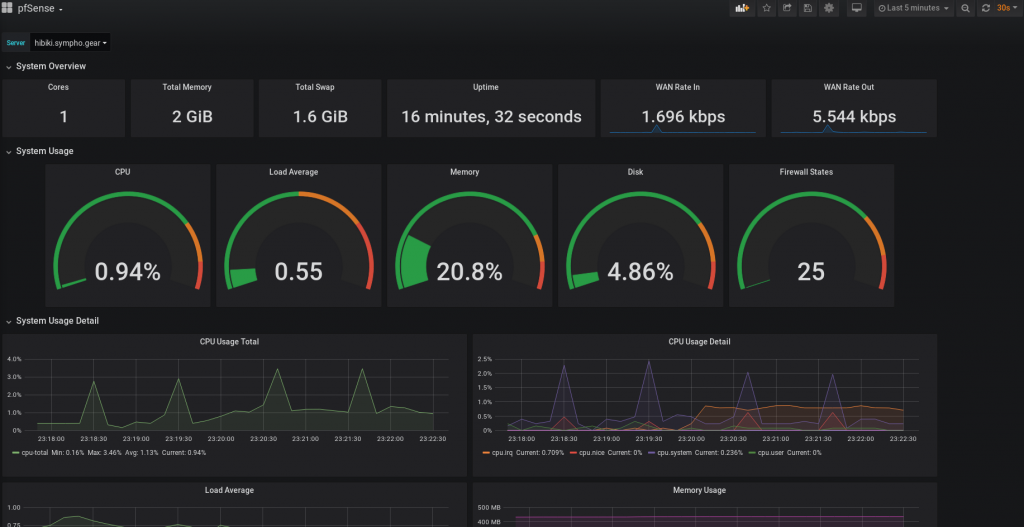
If everything went as it should, then the end result should be a dashboard that looks something like the following:
I hope this article was helpful! If you have any questions or input, feel free to leave a comment below. The same goes for if you have any requests for future articles.
SO much is implied I have no idea how to get this done. This guide is a waste of life.
What aspects of the process do you think are implied rather than explained?
did you install fluxdb and grafana on the pfsense system?
You install it on another machine. Telegraf will send data to that machine
I think the other pieces of this puzzle that are clearly implied are the influxdb and grafana installation and setup. Granted its easy to do but you should really start this guide with something stating “Influx and Grafana already installed” otherwise your guide is effectively useless.
Just start the guide or any guide with this in mind “Who is my audience for this content?”. Its implied that the audience here already have the backends installed.