How to install ElasticSearch and Logstash (and Kibana for ELK) in a TrueNAS Core Jail
Before we begin, lets see what a ELK stack is made of. ELK stacks are comprised of ElasticSearch, Logstash, and Kabina with each of these services preforming different jobs. This diagram from Logz.io explains its the best

Beats are installed to each host to collect the various metrics used by these services.
Logstash is responsible for the processing of the incoming logs and Aggregation into something in a common format.
ElasticSearch is the storage and index for the processed logs and metrics.
Kibana is the analysis and visualization for the data.
My setup is as follows:
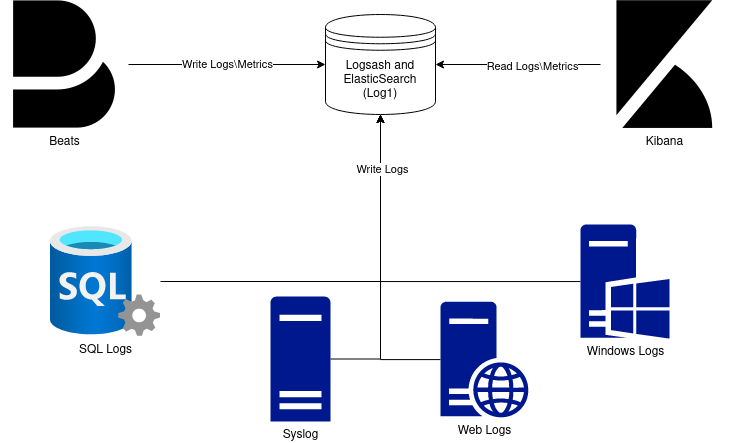
I have a multi server setup, with 1 hypervisor, ESXi and one SAN, TrueNAS. I could just have an ELK stack running in a vm and target NFS or iscsi on the storage server, or even just use a datastore where other vms are stored. The reason is not done that was is I want the logs to be revived by the storage directly so ZFS can handle the compression and long term storage of the logs. There also is am advantage of having better uptime since the SAN reboots much less often than my hypervisor host. I have a full ELK stack deployed, but kibana is running on an ESXi VM, not on TrueNAS. This is so the brunt of the analyzing will be done on the Hypervisor CPU not the storage CPU.
Beware the RAM and CPU requirements of my setup. My TrueNAS host in this setup is somewhat powerful (10 core, 20 thread CPU, 48GB RAM, with LOG and L2ARC SSD’s). Logstash and Elasticsearch can consume a lot of RAM. I have 8GB free for just this jail (just in case the usage gets high). This can be lowered by editing Java settings for each applications. The other thing to worry about is the CPU cycles. If you are using heavy compression like gzip or zstd this can heavily effect other process. I used this report , also this report, and a few others to base my decision on the compression levels. The applications themselfs can also use a lot of CPU depending on the log size and the filters applied. I would strongly recommend setting up grafana, telegraf, and influxDB or some similar long term monitoring setup to make sure your jail is not making your TrueNAS overloaded.
[Optional] Dataset Creation
For my setup, I am having Logstash and ElasticSearch store their files on separate datasets on my TrueNAS box. This is so I can easily migrate things in the future if it breaks, and so I can set custom compression and record sizes for the datasets to decrease storage consumed and speed of everything. I set my datasets up with the following settings:
Record size: 32KiB
Compression: ZSTD-6
Encryption: Inherit
Jail creation
To start with, Fetch the latest FreeBSD release for your system in the command line(in my case 12.2 because that is what TrueNas Core 12.0-U4.1 is biased on)
# iocage fetch
Once that is done, go and create a advanced jail. Name it what you want, Mine is Log1
In jail properties, allow allow_set_hostname, allow_mlock, and allow_mount. In the dropdown for allow mount, Give it
allow_mount_devs
allow_mount_nullfs
allow_mount_procfs
allow_mount_fusefs
allow_mount_tmpfs
Next, on networking, uncheck NAT, check VNET, checkBerkeley Packet Filterand give the jail an IP address, netmask, and gateway.
Finally the jail is created! Now we need to drop to command line and run the following
# iocage set mount_fdescfs=1 your-jail
# iocage set mount_procfs=1 your-jail
# iocage set enforce_statfs=1 your-jail
This will allow java8 to run because fdescfs and proc are needed by java to run correctly. The old way involved modifying enforce statfs for the system and setting it to 1. This is not recommended! The issue is that it changes how all jails operate and lead to some system instability. With this method, it changes just this jails statfs settings.
If you have datasets to mount, this is where you would do it. Mine are setup like this: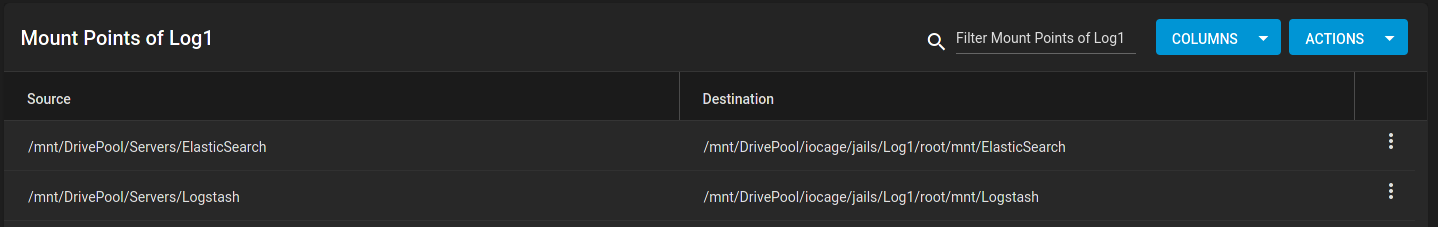
Now we can finally start the jail. If the jail is not starting, go to command line and run the following to debug. Berkley Packet Filter sometimes likes to enable. Disable it in the networking config for the jail.
# iocage start your-jail
Entering the jail
To get into the jail, run
# iocage console your-jail
All commands from this point on are in the jail, not TrueNAS
[Optional] Changing pkg to use the latest packages
If you want to run the latest of all of the software and not wait on quarterly updates, you can change the freebsd repo to use the latest. I use quarterly for stability above all else. If you want to run the latest, change the following:
# vim /etc/pkg/FreeBSD.conf
Change
FreeBSD: {
url: "pkg+http://pkg.FreeBSD.org/${ABI}/quarterly",
to:
FreeBSD: {
url: "pkg+http://pkg.FreeBSD.org/${ABI}/latest",
Installation
Install elasticsearch
# pkg install -y elasticsearch7
Install logstash
# pkg install -y logstash7
If you wanted the full ELK stack, Run # pkg install -y kibana7
Configuration
All of the configurations are store in /usr/local/etc/ under the respective application name. I am usingvim to edit my config files (install with # pkg install -y vim) If you want a simpler editor, use nano (install with # pkg install -y nano) Just replace use nano instead of vimin the commands below.
For elasticsearch, you need to find and configure the following lines in the config file to what you want it to be. Here is what I changed on mine.
# vim /usr/local/etc/elasticsearch/elasticsearch.yml
cluster.name: Logs
node.name: Log1
path.data: /mnt/elasticsearch # only change if you are mounting different datasets. Else set it to /var/db/elasticsearch
path.logs: /var/log/ElasticSearch
http.port: 9200
Once done with that, start and make the service start at boot
# sysrc elasticsearch_enable=YES
# service elasticsearch start
Any errors encountered should dump a log to the console or ssh session.
For Logstash, you dont have to change anything, but I changed some of the values. Here is what I changed on mine.
# vim /usr/local/etc/logstash/logstash.yml

node.name: Logs
path.data: /mnt/Logstash
pipeline.ordered: auto
path.config: /usr/local/etc/logstash/logstash.conf
http.host: 192.168.42.84
http.port: 9600-9700
Finally, start the and enable the services
# sysrc logstash_enable=YES
# service logstash start
Any errors encountered should dump a log to the console or ssh session.
If you want to configure kibana, follow this guide
Conclusion
Now you should have a ready to go ElasticSearch and Logstash Jail! If you have any issue please post about them here. Im not an expert by any means, but I may be able to help.
Thanks for this guide! I’ve been struggling to get ELK running smoothly in a TrueNAS jail for a while now. I especially appreciate the details on configuring the Java heap size in Elasticsearch – that’s often a sticking point.